In this post I attempt to isolate what I take to be three basic critical gestures that are performed in both “traditional” and “iterative” literary criticism. These gestures are: pointing, circling, and naming.
Before giving examples of these three gestures, a few words about what makes them possible in digital work: establishing a corpus, defining the limits of a single text, saying what will count as a token, and dividing these tokens (usually words or strings of words) into types.
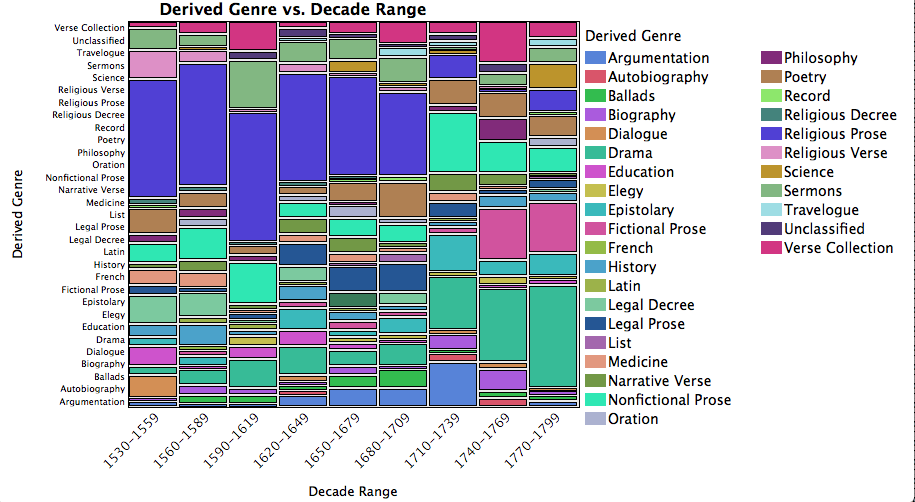
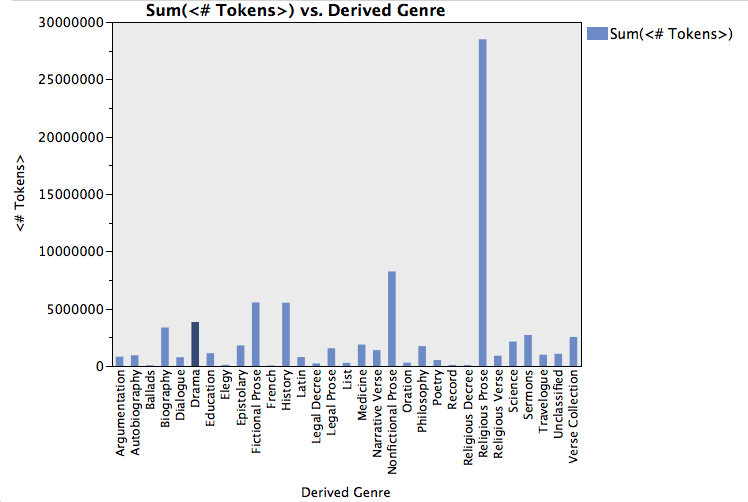
As an example, I take some of the work we’re doing on the Mellon grant, Visualizing English Print (VEP), which is currently focused on a corpus of 1080 texts. To prepare for this study, we have first to establish a corpus of texts, here 1080 items from the EEBO/TCP corpus, each over 500 words long, representing a selection of the full available contents in that corpus. The years represented in the sample range from 1530-1799.
The boundaries and contents of individual texts must also be established: we take each of the items in the corpus and treat the transcribed contents as stable, relying on the manual process of transcription to render the wayward glyph stream that is early modern print into an iterable, stable series of characters. The boundaries of the physical document are now the boundaries of a digital text that, among other things, can be addressed as a container of words.
Next we consider each text as a collection of tokens – words or strings of words – that can be aggregated into subgroups of types. This is a motivated process, since no text will tell you how to group its contents. The decision to group certain tokens into types is just that: a decision or motivated judgment based on a set of interpretive criteria whose result – words grouped into types – is a tagging scheme. (One can use each word as a type, but that is simply a limit case.) If the tagging scheme is that of Docuscope, we will be working with the familiar series of types that Jonathan Hope and I advert to in our analyses: FirstPerson, CommonAuthority, etc.
The number of possible tokenization schemes is potentially infinite. For example, we could type the tokens by grammatical function (noun, verb), linguistic origin (words entering the language after the Norman Conquest), or – to illustrate the point – “all of the words Jonathan Hope really likes” versus “all of the words Mike Witmore really likes.” The Oulipien Georges Perec, on the other hand, might isolate all words missing the letter “e.” All words used by Abraham Lincoln, as opposed to Hillary Clinton. You get the picture.
Based on this tagging scheme, we use mathematics to describe relationships among texts in our corpus, knowing full well that the complexity of the texts has been caricatured through a series of abstractions. Tokens reside – like elements in a logical set – within their types, all of which are present or absent to varying degrees in the individual containers (texts) of our corpus. Represented in this abstract form, we are dealing with extensions of sets and relationships among those sets, none of which are interpretable: these are simply things to be described.
I would call this initial procedure a diagrammatic reduction of the complexity of texts, diagrammatic because the encapsulation of types of words within different texts – when represented mathematically – highlights some things while hiding others. The point of a diagram is not to represent all aspects of the thing diagrammed: its power comes from its ability to illuminate a mode of relation among elements in the thing being represented. I draw a circle in a painting and it represents the sun: the circle is not the sun, and it oversimplifies the edge of the object that we call the sun, since that object has no stable “edge.” But the circle caricatures that object in an interested, useful, and sharable way. What I want you to grasp about the sun, and all other spherical things represented by a circle, is that we can describe its shape in a shorthand: it is one of those things whose edges all sit at the same distance from its center. The diagram is a tool for compression.
We could debate whether or not this particular relation is one of the things that is most important about the sun, debating the correspondence of the diagram with the object. That’s one conversation. But once we begin thinking about the diagram itself, which is a sketch of a set of relations, we might (as I do) feel comfortable talking about the reality of a set of relations. Mathematics is one language in which that reality can be described, and our analysis of texts – and the visualizations we use to explore and conduct such analysis – are just like this circle standing for the sun.
Now think about this snippet below of one of our very large dendrograms, which uses Ward’s clustering algorithm to show the linguistic distances (derived from Docuscope counts) between texts in our corpus. The texts have already been “reduced” to points in a multidimensional space, where each dimension represents a type that Docuscope counts and groups in the individual text-containers. (The types, of course, could have been anything else, and the results would be different.)

First interesting finding: most of the religious prose texts in this corpus, represented in purple, cluster together, but are distinct from another cluster of fictional prose texts. (See Pamela, Ko89369.003 in the olive green above: genre designations were derived from the Helsinki corpus and applied “by hand” to the 1080 items.) Once we begin working at this level of abstraction, we are well into the realm of interpretation, even though we are working with a diagram that is not itself an interpretation. Why? Because we are asking if certain types of words (the ones counted, in this case, by Docuscope) are present or absent in certain kinds of texts (texts identified as being fictional, subdivided into novels and plays).
What are the layers of interpretation, or choices, that could have been otherwise? The first is the selection of items for the corpus and stabilization of the texts, their boundaries, and contents. The second layer is distributed within in the tokenization scheme (Docuscope) that has been used to measure the abstract relationships among types of words, themselves contained to varying degrees within the texts represented here. Interpretive layer three is built into the colors used in the diagram. These colors represent genres or kinds of texts. Without this crucial layer of judgments – the circles draws around sets of texts that say, “these are different from others in a significant way” – we would be left with this:

Now consider doing this kind of work on a corpus of tens of thousands of texts. How would you interpret this very large diagram without any color coding to define groups? You couldn’t. The point is that one must first make a certain powerful critical gesture, drawing a circle around a group of things, if one wants to explore what makes various kinds of texts hang together at the level of the sentence – at the level of repeated or omitted bits of language.
And there is another critical gesture that occurs silently in the color coded diagram: the naming of a group. “These texts are religious prose, those prose fiction.” We have named two of the several kinds of creatures in this population. Do such names exhaust or fully describe the varieties of language present in these groups? Of course not. We employ names of this sort for much the same reason we are drawn to diagrams: because they have a certain compressive force, standing here for a suite of features, even a single feature, that somehow defines a group.
The final gesture in this critical ecology is pointing. I go to a particular text–say, Pamela, highlighted in the diagram below–and make a claim about its exemplarity based either on my own reading, its visible proximity to other texts, or both:

“Like its neighbor Clarissa, Pamela is representative of a kind of text called the novel.” As the statement suggests, I am interested in a certain sort of critical adjacency: what is next to the first exemplary or “classic” work, Clarissa, and why? Pamela, another famous novel, is a near neighbor. I agree they are of a similar kind and even know they are written by the same author. I know too that they are both epistolary. But what else can I say?
Having reached this point, I must now burrow down into exemplarity, making explicit what I mean when using this term (e.g., “prose fiction,” or “the novel”). I must, in other words, reverse the marvelous heuristic work of compression and identify the angle from which my diagrammatic reduction of their contents seemed natural or obvious.
This ability to compress a set of impressions using an example and then expand on what that example represents is utterly basic to our work in the humanities. “Show me your passages,” we say in class, or at a conference. The demand can also be made of an iterative criticism: “Show me the type of words that make this the kind of text it is. Let me see them acting ‘in the wild,’ in an exemplary passage.”
In later discussions, we will try to identify just such an exemplary passage within the circle of texts given the name of “prose fiction.” I pause before doing so to recognize that there is an astonishing amount of comparison underneath even the most simple critical claim such as, “Pamela is a representative work of prose fiction.” This one statement points, circles, and names: the three basic gestures in an ecology of criticism.
Such claims predate computers. Aristotle makes several in the Poetics, for example, when he identifies those features that make a given dramatic plot “necessarily finer” than others. We make the same sorts of claim today, although we can now do so in both discursive and diagrammatic form.