Category: Uncategorized

  • Scotland’s Collections and the Digital Humanities

    On 2nd May 2014 I’m presenting at the second event in this series, entitled ‘Working with Data’. This post is intended mainly for those who come to the session as a record of links I’ll mention, and a resource for those starting out in text analysis. It may also be useful for others as a collection of material.

    UPDATE: This is Mia Ridge’s page of resources for ‘Data Visualisation for Analysis in Scholarly Research‘, a course she teaches at the British Library (and updates regularly). The list is excellent. Twitter: @mia_out

    from my presentation:

    http://blogs.ucl.ac.uk/transcribe-bentham/             – crowdsourced, TEI transcriptions

    http://www.textcreationpartnership.org/tcp-eebo/             – University funded double keyed transcriptions, TEI

    http://www.tei-c.org/index.xml                            – Text Encoding Initiative: standards, training, resources, other projects

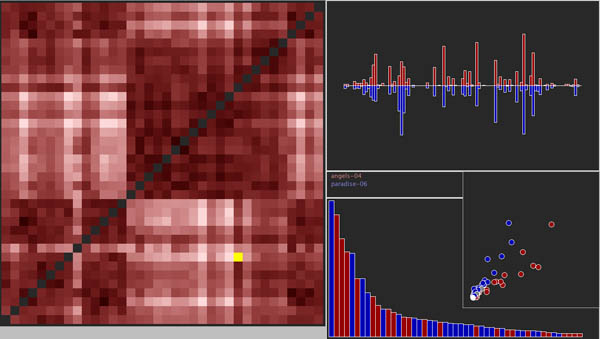
    http://earlyprint.wustl.edu                                      – examples of visualisations

    http://voyant-tools.org                                             – some basic text analysis tools

    http://www.wordle.net                                            – self-confessed ‘toy’ for word-clouds

    http://mallet.cs.umass.edu                                   – more serious set of text analysis tools

    http://ucrel.lancs.ac.uk                                         – Lancaster University’s UCREL site: wide range of corpora and tools including

    http://ucrel.lancs.ac.uk/vard/about/                – automatic modernisation of spelling


    Resources for text analysis

    0          Introductions/anthologies available on the web

    0.1       Literary Studies in the Digital Age: An Evolving Anthology, edds Kenneth M. Price, University of Nebraska, LincolnRay Siemens, University of Victoria


    http://dlsanthology.commons.mla.org


    Alan Liu, “From Reading to Social Computing”

    David L. Hoover, “Textual Analysis”

    Susan Schreibman, “Digital Scholarly Editing”

    Charles Cooney, Glenn Roe, and Mark Olsen, “The Notion of the Textbase: Design and Use of Textbases in the Humanities”

    Stéfan Sinclair, Stan Ruecker, and Milena Radzikowska, “Information Visualization for Humanities Scholars”

          William A. Kretzschmar, Jr., “GIS for Language and Literary Study”

                       Tanya Clement, “Text Analysis, Data Mining, and Visualizations in Literary Scholarship”

    Julia Flanders, “The Literary, the Humanistic, the Digital: Toward a Research Agenda for Digital Literary Studies”

    Daniel Powell, with Constance Crompton and Ray Siemens, “Glossary of Terms, Tools, and Methods”


    0.2       A Companion to Digital Literary Studies (Blackwell)

    http://www.digitalhumanities.org/companionDLS/


    0.3       A Companion to Digital Humanities (Blackwell)

    http://www.digitalhumanities.org/companion/


    0.4       Misc: Matt Jockers http://www.matthewjockers.net/2013/01/03/advice-for-dh-newbies/


    Ryan Cordell, ‘doing digital humanities’  http://ryan.cordells.us/s13dh/


    http://prezi.com/r7rmqbxifpq9/introducing-digital-humanities-full/?utm_source=twitter&utm_medium=landing_share


    1          Text Analysis


    1.1       TextAnalytics 101 by John Laudun (@johnlaudun)


    http://johnlaudun.org/20130221-text-analytics-101/


    A very clear guide to basic text analytics, and why numbers might get you and your students into the language of texts.


    The piece will set you up to do basic analysis with Python scripts if you want, but you don’t need to do this to follow the argument, which deals thoughtfully with the ‘why bother?’ of text analytics. Highly recommended.


    1.2       Where to start with text mining


    http://tedunderwood.com/2012/08/14/where-to-start-with-text-mining/


    Slightly different tack from Laudun, as stresses the need to compare large numbers of texts. Very clear about basic principles.


    1.2       Lisa Spiro: introduction to text analysis, powerpoint presentation – a good overview with further links, should be understandable even without the talk


    http://digitalscholarship.wordpress.com/2013/01/31/slides-and-exercises-from-doing-things-with-text-workshop/


    1.3       Michael Ullyot: data curation and an overview of text analysis – another excellent overview, specifically on Early Modern material, but relevant generally


    http://ullyot.ucalgaryblogs.ca/2012/09/07/data-curation-in-the-networked-humanities/


    1.4       Text Analytics: higher level debates on The Waves


    http://cforster.com/2013/02/reading-the-waves-with-stephen-ramsay/

    from this graduate DH class http://630dh.cforster.com/syllabus/


    2          Network analysis


    2.1       Map your facebook network with Gephi: a tutorial


    http://pegasusdata.com/2013/01/10/facebook-friends-network-mapping-a-gephi-tutorial/


    2.2       scottbot on hartlib correspondence: heatmap and network visualisations


    http://scottbot.net/uploads/map/demo/maps_heatmap_layer/hartlibEurope.html


    3          Literary History


    3.1       DH is changing what literary history is – and suggesting that we don’t actually know what it is. Here is Ted Underwood (@Ted_underwood) on the rise and fall of first person in the novel:


    http://tedunderwood.com/2013/02/08/we-dont-already-know-the-broad-outlines-of-literary-history/


    and see other posts at http://tedunderwood.com


    3.2       For a discussion of ‘influence’, and links to Matt Jockers’ work, see


    http://winedarksea.org/?p=1629


    3.3       Proportions of male/female pronouns:


    http://sappingattention.blogspot.ru/2013/02/genders-and-genres-tracking-pronouns.html

    http://sappingattention.blogspot.co.uk/2013/02/canonic-authors-and-pronouns-that-they.html


    5          Critique


    5.1 Wendy Hui Kyong Chun


    http://www.c21uwm.com/2013/01/09/the-dark-side-of-the-digital-humanities-part-1/#more-348

    http://chronicle.com/blogs/conversation/2013/01/05/on-the-dark-side-of-the-digital-humanities/

    http://www.queergeektheory.org/2013/01/mla13-the-dark-side-of-digital-humanities/

    http://www.dispositio.net/archives/1340


    6          Lists/surveys of tools:


    6.1       Jeffrey McClurken (University of Mary Washington) http://mcclurken.org/   : guide to digital history.


    https://docs.google.com/document/d/1GIV0xQOl5ZNHdguTZy7mpECsil6mu_ZqkZXjhjpE0eg/edit?pli=1


    6.2       http://dirt.projectbamboo.org/

    “Bamboo DiRT is a tool, service, and collection registry of digital research tools for scholarly use. Developed by Project Bamboo, Bamboo DiRT makes it easy for digital humanists and others conducting digital research to find and compare resources ranging from content management systems to music, OCR, statistical analysis packages to mindmapping software.”


    6.3       http://journalofdigitalhumanities.org/about/

    “The Journal of Digital Humanities (ISSN 2165-6673) is a comprehensive, peer-reviewed, open access journal that features the best scholarship, tools, and conversations produced by the digital humanities community in the previous quarter.

    The Journal of Digital Humanities offers expanded coverage of the digital humanities in three ways. First, by publishing scholarly work beyond the traditional research article. Second, by selecting content from open and public discussions in the field. Third, by encouraging continued discussion through peer-to-peer review.”


    6.4       http://digitalhumanitiesnow.org/

    “Digital Humanities Now showcases the scholarship and news of interest to the digital humanities community through a process of aggregation, discovery, curation, and review. Digital Humanities Now also is an experiment in ways to identify, evaluate, and distribute scholarship on the open web through a weekly publication and the quarterly Journal of Digital Humanities.

    WHAT WE PUBLISH

    Digital Humanities Now highlights work from the open web that has gotten the attention of the digital humanities community or is worthy of such attention, based on critical editorial review. Scholarship—in whatever form—that drives the field of digital humanities field forward is highlighted in the Editors’ Choice column. Additional news items of interest to the field—jobs, calls for papers, conference and funding announcements, reports, and recently-released resources—also are redistributed.”


    6.5       http://selection.datavisualization.ch/

    “Datavisualization.ch Selected Tools is a collection of tools that we, the people behind Datavisualization.ch, work with on a daily basis and recommend warmly. This is not a list of everything out there, but instead a thoughtfully curated selection of our favourite tools that will make your life easier creating meaningful and beautiful data visualizations.”

    6.6       40 Essential Tools and Resources to Visualize Data

    http://flowingdata.com/2008/10/20/40-essential-tools-and-resources-to-visualize-data/


    Jonathan Hope/May 2014

  • The Future of the Humanities Will Be Demand-Led

    gregoireIX
    Grégoire IX approbation de la Decretals (détail) 1511. Fresque Stanza della Segnatura, Palazzi Pontifici, Vatican

    The following is an unpolished contribution to some recent debates about the wisdom of defending, or ceasing to defend, the humanities. In what follows, I do not discuss what is deep, rich, and wonderful about the humanities. People who already care already know. I believe the public discussion ought to start somewhere else.

    When I think about the future of the humanities, I wonder why something that is so imaginative and  absorbing– so obviously disconnected from “making stuff” and “getting ahead” – would ever be tolerated in our society. I think that’s where discussion of the fate of the humanities ought to start, since humanistic thinking of one form or another has been around for a long time, ever since universities were given, by papal gift, the power to confer their own degrees in the 13th century. Why on earth would the Pope give anyone that kind of freedom, which would eventually include freedom of university masters from prosecution for heresy? (Think of Aquinas in scholastic debate on the thesis: God does not exist.) Why let students read all kinds of potentially subversive things in the arts curriculum, even if it was in Latin? The brutal, pragmatic answer: the papal bureaucracy required literate scribes, and universities trained them. It was a deal the Pope had to make.

    I wouldn’t shy away from making the same argument today. We need people who actually know how to read and write – who can communicate remotely in large, far flung organizations. If you know how to write well, your ability to advance in a networked bureaucracy multiplies. Indeed, communication through such networks *is* work in the 21st century, so there are a lot of opportunities for humanists to ply their skills. Look at someone who is commanding the world from a Blackberry. Many such people started out as good writers, even if they eventually arrived at the point where they could do their persuading telegraphically – with their thumbs!

    The second thing that needs to be said about the humanities is this: the humanities exist to give fundamentalism a run for its money. (I assume fundamentalisms come in many forms: ethnocentric, theological, economic, scientistic, etc.) Get rid of the humanities, and you’ll be spending a lot more time with fundamentalists. In a democratic republic, the humanities are an infrastructure investment, providing the cultural equivalent of a flood barrier. This case is harder to make in a post-culture-wars world, but it is the strongest one I know. Yes, the strongest.

    A third argument: global development demands humanistic learning as well as technological savvy. You cannot make intelligent investments, or avoid damaging military entanglements abroad, if you don’t have specific knowledge of other cultures. General Karl Eikenberry has talked eloquently about this, and Paul Smith of the British Council is organizing some events around the world on this topic. Smith, who is stationed here in Washington, talks often of an  “activist humanities.” Perhaps we need “humanities rapid response teams” that can be dispatched at a moment’s notice to deal with situations where deep, cultural knowledge is urgently needed.

    Finally, there is the question of humanities vs. academic humanities. The latter is shrinking, and so we may well be entering a post-academic age of the humanities. That might be OK. I think growth in the humanities (yes, growth) is going to be demand-led in the coming decades: as the number of professional academic humanists shrinks (and it will), the driver of humanistic thinking will be people – all kinds of people – who are puzzled by the mysteries of being human and want to talk about them. I see no reason to be anything but hopeful about that kind of future, since it is this population that will want (once again) to spend time studying the incredible texts and objects we humanists find so interesting and important. Humanities professors are a vital part of this broader, demand-led model for the humanities, and may at times influence the demand. In the long term, I suspect that we will want those professors back, and building demand – in schools, public libraries, around dinner tables– is what we ought to do next.


  • Fuzzy Structuralism

    Several years ago I did some experiments with Franco Moretti, Matt Jockers, Sarah Allison and Ryan Heuser on a set of Victorian novels, experiments that developed into the first pamphlet issued by the Stanford Literary Lab. Having never tried Docuscope on anything but Shakespeare, I was curious to see how the program would perform on other texts. Looking back on that work, which began with a comparison of tagging techniques using Shakespeare’s plays, I think the group’s most important finding was that different tagging schemes can produce convergent results. By counting different things in the texts – strings that Docuscope tags and, alternatively, words that occur with high frequency (most frequent words) – we were able to arrive at similar groupings of texts using different methods. The fact that literary genres could be rendered according to multiple tagging schemes sparked the idea that genre was not a random projection of whatever we had decided to count. What we began to think as we compared methods, and it is as exciting a thought now as it was then, was that genre was something real.

    Real as an iceberg, perhaps, genre may have underwater contours that are invisible but mappable with complementary techniques. Without delving too deeply into the specifics of the pamphlet, I’d like to sketch its findings and then discuss them in some of the terms I outlined in the previous post on critical gestures. First the preliminaries. In the initial experiment, we established a corpus (the Globe Shakespeare) and then used two tagging schemes to assign the tokens into those documents to a smaller number of types. (This is the crucial step of reducing the dimensionality of the documents, or “caricaturing” them.) The first tagging scheme, Docuscope, rendered the plays as percentage scores on the types it counts; the second, implemented by Jockers, identified the most frequent words (MFWs) in the corpus and likewise used these as the types or variables for analysis.

    What we found was that the circles drawn by critics around these texts – circles here bounding different genres – could be reproduced by multiple means. Docuscope’s hand-curated tagging scheme did a fairly good job of reproducing the genre groupings via an unsupervised clustering algorithm, but so did the MFWs. We were excited by these results, but also cautious. Perhaps the words counted by Docuscope might include the very MFWs that were producing such good results in the parallel trial, which would mean we were working with one tokenization scheme rather than two. Subsequent experiments on Victorian novels curated by the Stanford team – for example, a comparison of the Gothic Novel versus Jacobin (see pp. 20-23) – showed that Docuscope was adding something over and above what was offered by counting MFWs. MFWs such as “was,” “had,” “who,” and “she,” for example were quite good at pulling these two groups apart when used as variables in an unsupervised analysis. But these high frequency words, even when they composed some of the Docuscope types that were helpful in sorting the genres, were correlated with other text strings that were more narrative in character, phrases such as “heard the,” “reached the,” and “commanded the.” So while we had some overlap in the two tagging schemes, what they shared did not explain the complementary sorting power each seemed to bring to the analysis. The rhetorical and semantic layers picked out in Docuscope were, so to speak, doing something alongside the more syntactically important function words that occur in texts with such high frequency.

    The nature of that parallelism or convergence continues to be an interesting subject for thought as we discover more tagging schemes and contemplate making our own. Discussions in the NEH sponsored Early Modern Digital Agendas workshop at the Folger, some of which I have been lucky enough to attend, have pushed Hope and me to return to the issue of convergence and think about it again, especially as we think about how our research project, Visualizing English Print, 1470-1800, might implement new tagging schemes. If MFWs produce viable syntactical criteria for sorting texts, why would this “layer” of syntax be reliably coordinated with another, Docuscope-visible layer that is more obviously semantic or rhetorical? If different tagging schemes can produce convergent results, is it because they are invoking two perspectives on a single entity?

    Because one doesn’t get completely different groupings of texts each time one counts new things, we must posit the existence of something underneath all the variation, something that can be differently “sounded” by counting different things. The main attribute of this entity is its capacity to encourage or limit certain sorts of linguistic entailments. As I think back on how the argument developed in the Stanford paper with Moretti et al., the crucial moment came when we found that we could describe the Gothic novel as having both more spatial prepositions (“from,” “on,” “in,” “to”) and more narrative verb phrases (“heard the,” “reached the”) than the Jacobin novel. Our next move was to begin asking whether either of the tagging schemes was picking out a more foundational or structural layer of the text – whether, for example, the decision to use a certain type of narrative convention and, so, narrative phrase, entailed the use of corresponding spatial prepositions. As soon as the word “structural” appeared, I think everyone’s heart began to beat a little faster. But why? What is so special about the word “structural,” and what does it mean?

    In the context of this experiment, I think “structural” means “is the source of the entailment;” its use, moreover, suggests that the entailment has direction. We (the authors of the Stanford paper) were claiming that, in deciding to honor the plot conventions of a particular generic type, the writer of a Gothic novel had already committed him or herself to using certain types of very frequent words that critics tend to ignore. The structure or plot was obligating, perhaps in an unconscious way.

    I think now that I would pause before using the word “structure,” a word used liberally in that paper, not because I don’t think there is such a thing, but because I don’t know if it is one or many things. Jonathan Hope and I have been looking for a term to describe the entailments that are the focus of our digital work. We have chose to adopt, in this context, a deliberately “fuzzy structuralism” when talking about entailments among features in texts. We would prefer to say, that is, that the presence of one type of token (spatial preposition) seems to entail the presence of another type (narrative verb phrases), and remain agnostic about the direction of the entailment. Statistical analysis provides evidence of that relationship, and it is the first order of iterative criticism to describe such entailments, both exhaustively (by laying bare the corpus, counts, and classifying techniques) and descriptively (by identifying, through statistical means, passages that exemplify the variables that classify the texts most powerfully). Just as important, we feel one ought where possible to assign a shorthand name – “Gothicness,” “Shakespearean” – to the features that help sort certain kinds of texts. In doing so, we begin to build a bridge connecting our linguistic description to certain already known genre conventions that critics recognize or “circle” in their own thinking. But the application of the term”Gothic,” and the further claim that this names the cause of the entailments we discern by multiple means, deserves careful scrutiny.

    A series of questions about this entailment entity, then, which sits just under the waterline of our immediate reading:

    • How does entailment work? This is a very important question, since it gets at the problem of layers and depth. At one point in the work with the Stanford team, Ryan Heuser offered the powerful analogy alluded to above: genre is like an iceberg, with features visible above the water but depths unseen below. Plot, we all agreed, is an above the waterline phenomenon, whereas MFW word use and certain semantic choices are submerged below the threshold of conscious attention. In the article we say that the below-the-waterline phenomena sounded by our tagging schemes are entailed by the “higher order” choices made when the writer decided to write a “Gothic novel” or “history play.” I still like this idea, but worry it might suggest that all features of genre are the result of some governing, genre-conscious choice. What if some writers, in learning to mimic other writers, take sentence level cues and work “upward” from there? Couldn’t there be some kind of semi-conscious or sentence-based absorption of literary conventions that is specifically not a mimicry of plot?

    • Are the entailments pyramidal, with a governing apex at the top, or are they multi-nodal and so radiating from different points within the entity? I can see how syntax, which is mediated by function or high-frequency words, is closely tied to certain higher order choices. If I want to write stories about lovers who don’t get along, this will entail using a lot of singular pronouns in the first and second person alongside words that support mutual misunderstanding. There is a relationship of entailment between these two things, and the source of that entailment is often called “plot” or “genre.” Here again we are at an interpretive turning point, since the names applied to types of texts are as fluid, at least potentially, as those assigned to types of words. Such names can be misleading. Suppose, for example, that I have identified the distinct signature of something like a “Shakespearean sentence,” and that this signature is apparent in all of Shakespeare’s plays. (An author-specific linguistic feature set was created for J. K. Rowling just last week.) Suppose further that, as Shakespeare is almost singlehandedly launching the history play as a theatrical genre in the 1590s, this authorial feature propagates alongside the plot-level features he establishes for the genre. Now someone shows that this Shakespearean sentence signature is reliably present in most plays that critics now call histories. Is that entailment upheld by the force of genre or authorship? The question would be just as hard to answer if we noticed that the generic signal of history plays spans the rest of Shakespeare’s writing and is a useful feature for differentiating his works from those of other authors.

    • If entailments can be resolved at varying depths of field, like the two cats below, which are simultaneously resolved by the Lytro Camera at multiple focal lengths, how can we be sure that they are individual pieces of a single entity or scene? Different tagging schemes support the same groupings of texts, so there must be something specific “there” to be tagged which has definite contours. I remain astonished that the groupings derived from tagging schemes like Docuscope and MFWs correspond to names we use in literary criticism, names that designate authors and genres of fiction. But entailments are plural: some seem to correspond to what we call authorship, others  genre, and perhaps still others to the medium itself (the small twelvemo, for example, often contains different kinds of words than those found in the larger folio format). There are biological constraints on how long we can attend to a single sentence. The nature and source of these entailments has thus got to be the subject of ongoing study, one that bridges a range of fields as wide as there are forces that constrain language use.

    Entailment is real; it suggests an entity. But how should we describe that entity, and with what terms or analogies can its depths be resolved? Sometimes there may be multiple cats, sitting apart in the same room. Sometimes what seems like two icebergs may in fact be one.

    Image from the Lytro Camera resolving objects at multiple depths


  • The very strange language of A Midsummer Night’s Dream

    I just got back from a fun and very educative trip to Shakespeare’s Globe in London, hosted by Dr Farah Karim-Cooper, who is director of research there.

    The Globe stages an annual production aimed at schools (45,000 free tickets have been distributed over the past five years), and this year’s play is A Midsummer Night’s Dream. I was invited down to discuss the language of the play with the cast and crew as they begin rehearsals.

    This was a fascinating opportunity for me to test our visualisation tools and analysis on a non-academic audience – and the discussions I had with the actors opened my eyes to applications of the tools we haven’t considered before. They also came up with a series of sharp observations about the language of the play in response to the linguistic analysis.

    I began with a tool developed by Martin Mueller’s team at Northwestern University: Wordhoard, as a way of getting a quick overview of the lexical patterns in the play, and introducing people to thinking statistically about language.

    Here’s the wordcloud Wordhoard generates for a loglikelihood analysis of MSND compared with the whole Shakespeare corpus:


    Loglikelihood takes the frequencies of words in one text (in this case MSND) and compares them with the frequencies of words in a comparison, or reference, sample (in this case, the whole Shakespeare corpus). It identifies the words that are used significantly more or less frequently in the analysis text than would be expected given the frequencies found in the comparison sample. In the wordcloud, the size of a word indicates how strongly its frequency departs from the expected. Words in black appear more frequently than we would expect, and words in grey appear less frequently.

    As is generally the case with loglikelihood tests, the words showing the most powerful effects here are nouns associated with significant plot elements: ‘fairy’, ‘wall’, ‘moon’, ‘lion’ etc. If you’ve read the play, it is not hard to explain why these words are used in MSND more than in the rest of Shakespeare – and you really don’t need a computer, or complex statistics, to tell you that. To paraphrase Basil Fawlty, so far, so bleeding obvious.

    Where loglikelihood results normally get more interesting – or puzzling – is in results for function words (pronouns, auxiliary verbs, prepositions, conjunctions) and in those words that are significantly less frequent than you’d expect.

    Here we can see some surprising results: why does Shakespeare use ‘through’ far more frequently in this play than elsewhere? Why are the masculine pronouns ‘he’ and ‘his’ used less frequently? (And is this linked to the low use of ‘lord’?) Why is ‘it’ rare in the play? And ‘they’ and ‘who’ and ‘of’?

    At this stage we started to look at our results from Docuscope for the play, visualised using Anupam Basu’s LATtice.


    The heatmap shows all of the folio plays compared to each other: the darker a square is, the more similar the plays are linguistically. The diagonal of black squares running from bottom left to top right marks the points in the map where plays are ‘compared’ to themselves: the black indicates identity. Plays are arranged up the left hand side of the square in ascending chronological order from Comedy of Errors at the bottom to Henry VIII at the top – the sequence then repeats across the top from left to right – so the black square at the bottom left is Comedy of Errors compared to itself, while the black square at the top right is Henry VIII.

    One of the first things we noticed when Anupam produced this heatmap was the two plays which stand out as being unlike almost all of the others, producing four distinct light lines which divide the square of the map almost into nine equal smaller squares:


    These two anomalous plays are Merry Wives of Windsor (here outlined in blue) and A Midsummer Night’s Dream (yellow). It is not so surprising to find Wives standing out, given the frequent critical observation that this play is generically and linguistically unusual for Shakespeare: but A Midsummer Night’s Dream is a result we certainly would not have predicted.

    This visualisation of difference certainly caught the actors’ attention, and they immediately focussed in on the very white square about 2/3 of the way along the MSND line (here picked out in yellow):


    So which play is MSND even less like than all of the others? A tragedy? A history? Again, the answer is not one we’d have guessed: Measure for Measure.

    This is a good example of how a visualisation can alert you to a surprising finding. We would never have intuited that MSND was anomalous linguistically without this heatmap. It is also a good example of how visualisations should send you back to the data: we now need to investigate the language of MSND to explain what it is that Shakespeare does, or does not do, in this play that makes it stand out so clearly. The visualisation is striking – and it allowed the cast members to identify an interesting problem very quickly – but the visualisation doesn’t give us an explanation for the result. For that we need to dig a bit deeper.

    One of the most useful features of LATtice is the bottom right window, which identifies the LATs that account for the most distance between two texts:


    This is a very quick way of finding out what is going on – and here the results point us to two LATs which are much more frequent in MSND than Measure for Measure: SenseObject and SenseProperty. SenseObject picks up concrete nouns, while SenseProperty codes for adjectives describing their properties. A quick trip to the LATice box plot screen (on the left of these windows):


    confirms that MSND (red dots) is right at the top end of the Shakespeare canon for these LATs (another surprise, since we’ve got used to thinking of these LATs as characteristic of History), while Measure for Measure (blue dots) has the lowest rates in Shakespeare for these LATs.

    So Docuscope findings suggest that MSND is a play concerned with concrete objects and their descriptions – another counter-intuitive finding given the associations most of us have with the supposed ethereal, fairy, dream-like atmosphere of the play. Cast members were fascinated by this and its possible implications for how they should use props – and someone also pointed out that many of the names in the play are concrete nouns (Quince, Bottom, Flute, Snout, Peaseblossom, Cobweb, Mote and so on) – what is the effect on the audience of this constant linguistic wash of ‘things’?

    Here is a screenshot from Docuscope with SenseObject and SenseProperty tokens underlined in yellow. Reading these tokens in context, you realise that many of these concrete objects and qualities, in this section at least, are fictional in the world of the play. A wall is evoked – but it is one in a play, represented by a man. Despite the frequency of SenseObject in this play, we should be wary of assuming that this implies the straightforward evocation of a concrete reality (try clicking if you need to enlarge):


    Also raised in MSND are LATs to do with locating and describing space: Motions and SpaceRelations (as suggested by our loglikelihood finding for ‘through’?). So accompanying a focus on things, is a focus on describing location, and movement – perhaps, someone suggested, because the characters are often so unsure of their location? (In the following screenshot, Motions and SpatialRelation tokens are underlined in yellow.)


    Moving on, we also looked at those LATs that are relatively absent from MSND – and here the findings were very interesting indeed. We have seen that MSND does not pattern like a comedy – and the main reason for this is that it lacks the highly interactive language we expect in Shakespearean comedy: DirectAddress and Question are lowered. So too are PersonPronoun (which picks up third person pronouns, and matches our loglikelihood finding for ‘he’ and ‘his’), and FirstPerson – indeed, all types of pronoun are less frequent in the play than is normal for Shakespeare. At this point one of the actors suggested that the lack of pronouns might be because full names are used constantly – she’d noticed in rehearsal how often she was using characters’ names – and we wondered if this was because the play’s characters are so frequently uncertain of their own, and others’ identity.

    Also lowered in the play is PersonProperty, the LAT which picks up familial roles (‘father’, ‘mother’, ‘sister’ etc) and social ones (job titles) – if you add this to the lowered rate of pronouns, then a rather strange social world starts to emerge, one lacking the normal points of orientation (and the play is also low on CommonAuthority, which picks up appeals to external structures of social authority – the law, God, and so on).

    The visualisation, and Docuscope screens, provoked a discussion I found fascinating: we agreed that the action of the play seems to exist in an eternal present. There seems to be little sense of future or past (appropriately for a dream) – and this ties in with the relative absence of LATs coding for past tense and looking back. As the LATtice heatmap first indicated, MSND is unlike any of the recognised Shakespearean genres – but digging into the data shows that it is unlike them in different ways:

    • It is unlike comedy in its lack of features associated with verbal interaction
    • It is unlike tragedy in its lack of first person forms (though it is perhaps more like tragedy than any other genre)
    • It is unlike history in its lack of CommonAuthority

    Waiting for my train back to Glasgow (at the excellent Euston Tap bar near Euston Station), I tried to summarize our findings in four tweets (read them from the bottom, up!):


    I’ll try to keep in touch with the actors as they rehearse the play – this was a lesson for me in using the tools to spark an investigation into Shakespeare’s language, and I can now see that we could adapt these tools to various educational settings (including schools and rehearsal rooms!).

    Jonathan Hope February 2012

  • Visualizing Linguistic Variation with LATtice

    The transformation of literary texts into “data” – frequency counts, probability distributions, vectors – can often seem reductive to scholars trained to read closely, with an eye on the subtleties and slipperiness of language. But digital analysis, in its massive scale and its sheer inhuman capacity of repetitive computation, can register complex patterns and nuances that might be beyond even the most perceptive and industrious human reader. To detect and interpret these patterns, to tease them out from the quagmire of numbers without sacrificing the range and the richness of the data that a text analysis tool might accumulate can be a challenging task. A program like DocuScope can easily take an entire corpus of texts and sort every word and phrase into groups of rhetorical features. It produces a set of numbers for each text in the corpus, representing the relative frequency counts for 101 “language action types” or LATs. Taken together, the numbers form a 101 dimensional vector that represents the rhetorical richness of a text, a literary “genetic signature” as it were.

    Once we have this data, however, how can we use it to compare texts, to explore how they are similar and how they differ? How can we return from the complex yet “opaque” collection of floating point numbers to the linguistic richness of the texts they represent? I wrote a program called LATtice that lets us explore and compare texts across entire corpora but also allows us to “drill down” to the level of individual LATs to ask exactly what rhetorical categories make texts similar or different. To visualize relations between texts or genres, we have to find ways to reduce the dimensionality of the vectors, to represent the entire “gene” of the text within a logical space in relation to other texts. But it is precisely this high dimensionality that accounts for the richness of the data that DocuScope produces, so it is important to be able preserve it and to make comparisons at the level of individual LATs.

    LATtice addresses this problem by producing multiple visualizations in tandem to allow us to explore the same underlying LAT data from as many perspectives and in as much detail as possible. It reads a data file from DocuScope and draws up a grid, or a heatmap representing “similarity” or “difference” between texts. The heatmap, based on the Euclidean distance between vectors, is drawn up based on a color coding scheme where darker shades represent texts that are “closer” or more similar and lighter shades represent texts further apart or less similar according to DocuScope’s LAT counts. If there are N texts in the corpus, LATtice draws up an “N x N” grid where the distance of each text from every other text is represented. Of course, this table is symmetrical around the diagonal and the diagonal itself represents the intersection of each text with itself (a text is perfectly similar to itself, so the bottom right “difference” panel shows no bars for these cases). Moving the mouse around the heatmap allows one to quickly explore the LAT distribution for each text-pair.

    Screenshot of LATtice

    While the main grid can reveal interesting relationships between texts, it hides the underlying factors that account for differences or similarities, the linguistic richness that DocuScope counts and categorizes so meticulously. However, LATtice provides multiple, overlapping, visualizations to help us explore the relationship between any two texts in the corpus at the level of individual LATs. Any text-pair on the grid can be “locked” by clicking on it, allowing the user to move to the LATs to explore them in more detail. The top right panel shows how LATs from both the texts relate to each other. The text on the X axis of the heatmap is represented in red and the one on the Y axis is represented in blue in the histogram for side by side comparison. All the other panels follow this red-blue color coding for the text-pair. The bottom panel displays only the LATs whose counts are most dissimilar. These are the LATs we will want to focus on in most cases as they account most for the “difference” between the texts in DocuScope’s analysis. If a bar in this panel is red it signifies that for this LAT, the text on the X axis (our ‘red’ text) had a higher relative frequency count while a blue bar signals that the Y axis text (our ‘blue’ text) had a higher count for a particular LAT. This panel lets us quickly explore exactly on what aspects texts differ from each other. Finally, LATtice also produces a scatterplot as a very quick way of looking at “similarity” between texts. It plots LAT readings of the two texts against each other and color codes the dots to indicate which text has a higher relative frequency for a particular LAT (grey dots indicate that both LATs have the same value). The “spread” of dots gives a rough indication of difference or similarity between texts: a larger spread indicates dissimilar texts and dots clustering around the diagonal indicate very similar texts.

    You can try LATtice out with two sample data-sets by clicking on the links below. The first is drawn from the plays of Shakespeare which are in this case arranged in rough chronological order. As Hope and Witmore’s work has demonstrated, the possibilities opened up by applying DocuScope to the Shakespeare corpus are rich and hopefully exploring the relationship between individual plays on the grid will produce new insights and new lines on inquiry. The second data-set is experimental – it tries to use DocuScope not to compare multiple texts but to explore a single text – Milton’s Paradise Lost – in detail. It might give us insights about how digital techniques can be applied on smaller scales with well-curated texts to complement literary close-reading. The poem was divided into sections based on the speakers (God, Satan, Angels, Devils, Adam, Eve) and the places being described (Heaven, Hell, Paradise). These chunks were then divided into roughly three hundred line sections. As an example, we might notice straightaway that speakers and place descriptions seem to have very distinct characteristics. Speeches are broadly similar to each other as are place descriptions. This is not unexpected, but what accounts for these similarities and differences? Exploring the LATs helps us approach this question with a finer lens. Paradise, for example, is full of “sense objects” while Godly and angelic speech does not refer to them as often. Does Adam refer to “authority” more when he speaks to Eve? Does Satan’s defiance leave a linguistic trace that distinguishes him from unfallen angels? Hopefully LATtice will help us explore and answer such questions and let us bring DocuScope’s data closer to the nuances of literary reading.


    Finally, a few technical notes: The above links should load LATtice with the appropriate data-sets. Of course, you will need to have Java installed on your machine and to have applets enabled in your browser. You can also download LATtice and the sample data-sets, along with detailed instructions, as stand-alone applications for the following platforms:

    There are a few advantages to doing this. First, the standalone version offers an additional visualization panel which represents the distribution of LATs as box-and-whisker plots and shows where the text-pair’s frequency counts stand relative to the rest of the corpus. Secondly, the standalone application can make use of the entire screen, which can be a great advantage for larger and higher resolution monitors.